React + material-table + typescriptでテーブルを作成する方法
Reactでページングやソート処理をしたくて調べていたら、material-tableが良さそうだったのでやってみた。
パッケージのインストール
Reactのプロジェクトにパッケージを追加する。@materia-ui/iconsはHTML内のLinkタグを指定すればインストール不要なのだが、リンクにしたくなかったのでインストールした。
$ yarn add material-table
$ yarn add @material-ui/core
$ yarn add @material-ui/icons
コード作成
import React, { forwardRef, Ref } from "react";
import MaterialTable, { Icons } from "material-table";
import AddBox from "@material-ui/icons/AddBox";
import ArrowDownward from "@material-ui/icons/ArrowDownward";
import Check from "@material-ui/icons/Check";
import ChevronLeft from "@material-ui/icons/ChevronLeft";
import ChevronRight from "@material-ui/icons/ChevronRight";
import Clear from "@material-ui/icons/Clear";
import DeleteOutline from "@material-ui/icons/DeleteOutline";
import Edit from "@material-ui/icons/Edit";
import FilterList from "@material-ui/icons/FilterList";
import FirstPage from "@material-ui/icons/FirstPage";
import LastPage from "@material-ui/icons/LastPage";
import Remove from "@material-ui/icons/Remove";
import SaveAlt from "@material-ui/icons/SaveAlt";
import Search from "@material-ui/icons/Search";
import SvgIcon from "@material-ui/core/SvgIcon";
import ViewColumn from "@material-ui/icons/ViewColumn";

const iconComponentByTableIconType: Record<keyof Icons, typeof SvgIcon> = {
  Add: AddBox,
  Check,
  Clear,
  Delete: DeleteOutline,
  DetailPanel: ChevronRight,
  Edit,
  Export: SaveAlt,
  Filter: FilterList,
  FirstPage,
  LastPage,
  NextPage: ChevronRight,
  PreviousPage: ChevronLeft,
  ResetSearch: Clear,
  Search,
  SortArrow: ArrowDownward,
  ThirdStateCheck: Remove,
  ViewColumn,
};

const tableIcons = Object.entries(iconComponentByTableIconType).reduce(
  (currentTableIcons: Icons, [tableIconType, IconComponent]) => {
    currentTableIcons[
      tableIconType as keyof Icons
    ] = forwardRef((props, ref: Ref<SVGSVGElement>) => (
      <IconComponent {...props} ref={ref} />
    ));
    return currentTableIcons;
  },
  {}
);

const MyTable = () => {
  return (
    <div style={{ maxWidth: "100%" }}>
      <MaterialTable
        icons={tableIcons}
        title="九州の人口(2018年度)"
        columns={[
          { title: "地域コード", field: "code", type: "numeric" },
          { title: "地域", field: "region" },
          { title: "総人口", field: "total", type: "numeric" },
          { title: "人口(男)", field: "male", type: "numeric" },
          { title: "人口(女)", field: "female", type: "numeric" },
        ]}
        data={[
          {
            code: 40000,
            region: "福岡県",
            total: 5107000,
            male: 2416000,
            female: 2691000,
          },
          {
            code: 41000,
            region: "佐賀県",
            total: 819000,
            male: 388000,
            female: 432000,
          },
          {
            code: 42000,
            region: "長崎県",
            total: 1341000,
            male: 631000,
            female: 710000,
          },
          {
            code: 43000,
            region: "熊本県",
            total: 1757000,
            male: 829000,
            female: 928000,
          },
          {
            code: 44000,
            region: "大分県",
            total: 1144000,
            male: 542000,
            female: 602000,
          },
          {
            code: 45000,
            region: "宮崎県",
            total: 1081000,
            male: 509000,
            female: 572000,
          },
          {
            code: 46000,
            region: "鹿児島県",
            total: 1614000,
            male: 758000,
            female: 856000,
          },
          {
            code: 47000,
            region: "沖縄県",
            total: 1448000,
            male: 712000,
            female: 736000,
          },
        ]}
        options={{
          sorting: true,
          headerStyle: {
            backgroundColor: "#01579b",
            color: "#FFF",
          },
        }}
      />
    </div>
  );
};

export default MyTable;
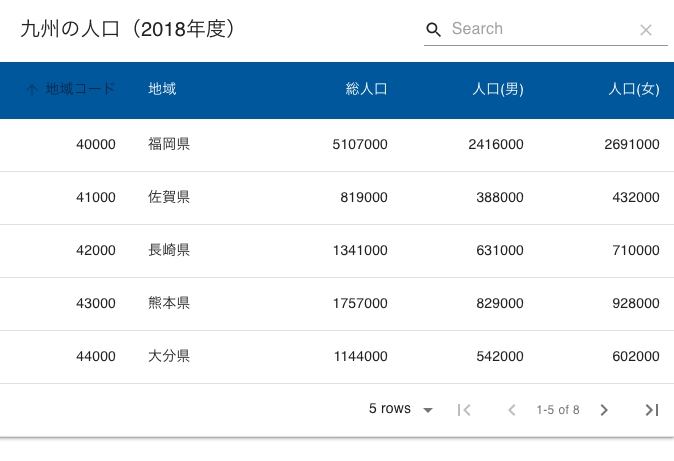
完成した画面
九州の人口がテーブルに表示された。ヘッダーのカラムをクリックするとソートできる。右下の矢印でページ移動も可能できる。検索ボックスに入力すると全データから検索してデータを絞れる。